What Workspace Utilization Really Measures
Workspace utilization is the cornerstone of effective workplace management. It’s not just about how many desks you have — it’s about how people actually use the space throughout the day. Many organisations discover that their assumptions about office utilization metrics differ dramatically from reality. The good news: most companies already have the space utilization data they need to begin understanding their hybrid office occupancy patterns.
What’s often missing isn’t technology — it’s interpretation. Workspace utilization becomes powerful when it moves from a percentage on a dashboard to an explanation of behaviour within a hybrid workplace.
Using Existing Data Sources to Build an Activity Picture
Before investing in sensors or major hybrid workplace analytics systems, many organisations can build a surprisingly accurate view using data they already collect for other purposes:
• Access control logs
Show who entered the building and when — revealing peak days, arrival patterns, and overall hybrid office occupancy variability.
• Network logins & Wi-Fi associations
Indicate when someone is active on the corporate network and where activity clusters across floors or zones.
• Peripheral systems (e.g., vending machines, printers)
Reveal distributed activity patterns and movement throughout the building.
Individually, these data sources give fragments of a story. Combined, they form a robust picture of occupancy trends, peak times, and building rhythms — the foundation of any effective workplace analytics strategy.
Very often, the first insight is this: the building isn’t underused — it’s unevenly used.
Observation-Based Utilization: What’s Actually Happening at Desks
Automated space utilization data can’t always reveal how space is truly being used. Direct observation remains one of the most reliable methods because it captures nuance that desk occupancy sensors miss.
A simple hourly walk-through — or a structured digital workflow — can categorise each desk as:
• In use
• Vacant
• Temporarily blocked (coat on chair, belongings left, laptop open)
• Unavailable (maintenance, privacy screens, specialist purpose)
This distinction is critical. Temporarily blocked desks often inflate perceived desk occupancy rates and distort reported workspace utilization.
Observation can also capture activity type, offering insight beyond simple presence:
• Focus work
• Team collaboration
• Heads-down individual tasks
• Ad-hoc conversations
This richer qualitative layer strengthens office utilization metrics by explaining why certain areas perform differently from others.
Meeting Room Utilization and Purpose
Meeting room utilization is one of the most scrutinised — and misunderstood — office utilization metrics.
Meeting rooms are among the most costly assets in any workplace portfolio. Understanding not just how often rooms are used, but how they are used, directly impacts office space optimisation decisions.
Key observations include:
• Meeting purpose:
Interview, conference call, internal meeting, external client meeting, informal chat.
• Room size vs. actual attendance:
Often a single person occupies a room designed for eight — creating artificial scarcity.
• Duration vs. room efficiency:
Long bookings for short meetings reduce availability and inflate perceived “shortage.”
Booking data alone can suggest high utilisation.
Attendance-based analysis often tells a different story.
Evaluating efficiency helps determine whether a meeting room shortage is real — or simply a mismatch issue within your workplace analytics strategy.
The Value — and Limits — of IoT Sensors
IoT sensors are powerful tools within hybrid workplace analytics, but they rarely tell the whole story.
Most sensor systems record presence at a desk — but people spend a significant portion of their day away from that desk:
• Getting coffee or tea
• Taking comfort breaks
• Lunch
• Visiting clients
• Working in breakout spaces
• Attending meetings
• Collaborating informally
In many hybrid environments, for every person sitting at a desk, another is “in the air.”
This creates one of the biggest challenges in modern office utilization metrics: the gap between desk occupancy vs access data.
From a sensor-based viewpoint, the building may appear half-empty.
From an access-control viewpoint, hybrid office occupancy may be near capacity.
Both are technically correct — they are simply measuring different behaviours.
Why Desk Occupancy vs Access Data Causes Conflict
A common organisational problem:
Access data suggests 1,000 people are in the building, but desk sensors report only 500 desks occupied.
Leaders may assume:
• space is underutilised,
• productivity is falling,
• or desks can be reduced immediately.
This is where misunderstanding office utilization metrics becomes risky.
Access data measures person presence.
Desk sensors measure seated time.
These are different inputs within your overall workplace analytics strategy.
Comparing them directly — without context — leads to flawed office space optimisation decisions.
Clear interpretation prevents internal conflict and protects long-term planning credibility.
When “In-the-Air” Exceeds Seated Staff: The Shift to Activity-Based Working
If the number of people not at desks consistently exceeds the number seated, your organisation is already operating within an activity-based working model — whether formally implemented or not.
Hybrid work patterns naturally increase mobility and task-switching.
If the physical environment remains desk-dominant, this creates tension:
• crowded informal spaces
• pressure on meeting rooms
• low desk occupancy metrics
• employee frustration
• space that looks empty but feels full
This is not a workspace utilization failure.
It is a misalignment between behavioural reality and spatial design.
Understanding this distinction is essential for strategic office space optimisation.
The Breakout Space Conundrum: Why They’re Often Empty
Breakout spaces often underperform in traditional space utilization data reports.
But low measurable utilisation does not automatically mean low value.
Common issues include:
• High-visibility placement
• Poor acoustics
• Lack of privacy
• Furniture that doesn’t support real tasks
Hybrid workplace analytics rarely capture emotional comfort, perceived exposure, or cultural hesitation — yet these strongly influence utilisation behaviour.
Employees need spaces that feel casual but confidential, flexible but functional.
Without those qualities, even well-designed breakout areas struggle to contribute meaningfully to overall workspace utilization.
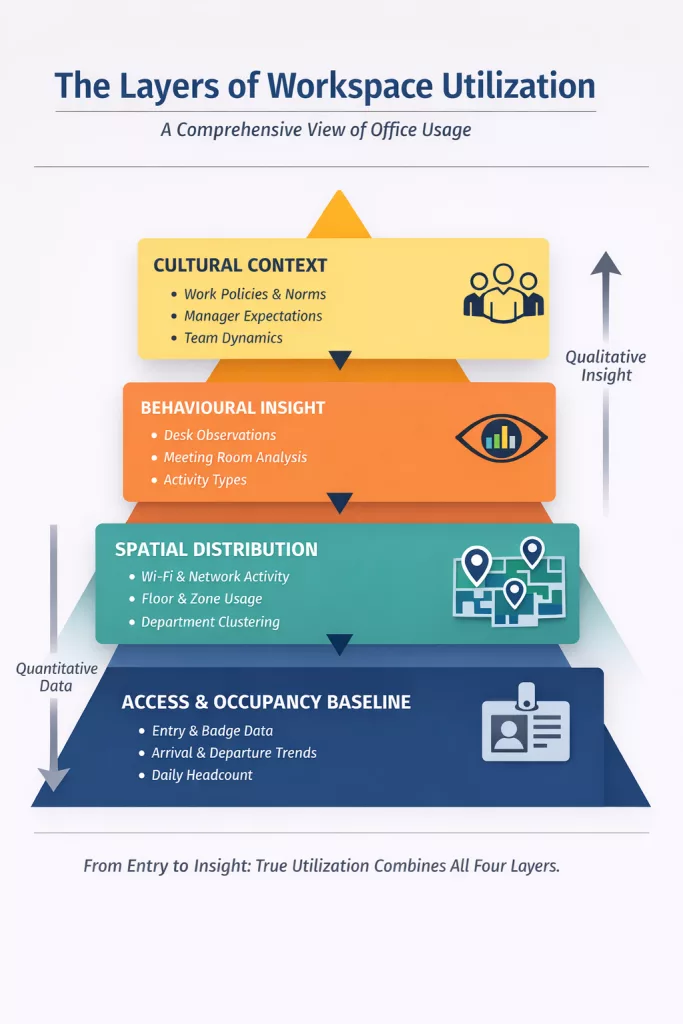
Putting It All Together: A Smarter Workplace Analytics Strategy
True workspace utilization is multi-dimensional.
A mature workplace analytics strategy blends:
• Access logs and hybrid office occupancy data
• Desk occupancy sensors
• Direct observation
• Meeting room utilization studies
• Behavioural context
• Cultural insight
Relying on any single office utilization metric risks misleading conclusions. Combining them provides not just a number — but clarity. And clarity is what enables confident decisions about redesign, reduction, expansion, or optimisation. Because workspace utilization is not about maximising seat fill. It’s about ensuring your space supports how your people actually work.