
Halloween might be behind us, but for many workspace managers, the real fright season is just beginning. As the pumpkins come down and the year-end holidays approach, utilisation across offices often starts to dip — desks sit empty, meeting rooms go quiet, and those once-busy breakout spaces suddenly feel like ghost towns.
It’s a predictable seasonal trend: after Halloween, engagement and attendance typically decline as people juggle annual leave, remote work, and end-of-year fatigue. The result? Spooky-looking occupancy statistics that can send a chill down any facilities manager’s spine.
But here’s the trick — not all scary stats are what they seem.

Looking Beyond Occupancy
Traditional occupancy data tells us how many people are in the office, but not why they’re there, how they’re using the space, or what drives those choices. That’s where behavioural analytics becomes the real treat.
By analysing patterns of movement, collaboration, and purpose-driven attendance, workspace teams can adapt environments to actual working behaviours — not just headcounts.
In this article, we’ll explore:
- Why the “holiday-season effect” hits workspaces each year.
- Why occupancy statistics can mislead.
- How observation studies and behavioural analytics elevate space strategy.
- How Accordant by CadM supports this shift.
- Practical steps to turn scary stats into actionable insight.
The Seasonal Utilisation Dip
As November arrives, utilisation typically falls for familiar reasons:
- Employees begin taking annual leave.
- Hybrid and remote work patterns reassert themselves.
- Year-end fatigue shifts focus toward wrapping up projects.
- In-person collaboration slows or moves to smaller, ad hoc settings.
The result? Desks and meeting rooms appear underused, and KPIs like occupancy rate or headcount drop sharply. Managers often panic, asking whether they should reduce space or reconfigure layouts.
But this is a seasonal illusion. Without behavioural context, the data can mislead — prompting reactive decisions that ignore what’s really happening in your workspace.
The Limits of Occupancy Metrics
Occupancy metrics answer “how many,” but not “how” or “why.” For example:
- A desk may be booked but unused due to remote work.
- Collaboration may happen in breakout zones rather than formal meeting rooms.
- Hybrid norms distort baselines — a drop from 90% to 60% occupancy might reflect stable engagement under new patterns.
These metrics risk undervaluing flexibility, culture, and informal collaboration. Relying solely on them can lead to short-sighted cuts or misaligned policies.
Blocked vs Utilised: The Hidden Story Behind the Numbers
One of the most common misinterpretations in workspace reporting is failing to distinguish between blocked and utilisedspace.
A blocked desk is unavailable for use — perhaps because it’s been booked but left empty, or because someone has left personal items there all day without actually working at it. From a sensor or booking system’s perspective, that desk appears “in use.” But in reality, it’s not generating productivity — it’s simply unavailable to others.
The same principle applies to meeting rooms. If two people occupy a six-person room, they’re using just a third of its capacity but blocking the remaining four seats from being used by anyone else. The room appears “fully booked” and “utilised,” but it’s actually only partially occupied.
This subtle distinction matters enormously when analysing workspace efficiency. During the post-Halloween and holiday period, when attendance drops, blocked space can distort utilisation figures — making offices seem busier (or emptier) than they truly are.
Behavioural observation and analytics help uncover these patterns. Instead of seeing “meeting rooms at 90% utilisation,” you might find that only 60% of the available seating capacity is ever used. Instead of “desks 80% occupied,” you may discover that 25% are blocked by personal effects or phantom bookings.
Accordant by CadM helps distinguish these nuances by layering booking data with observed activity and “signs of life” analysis. Using Accordant Anywhere, facilities teams can conduct walk-round surveys to identify blocked versus genuinely utilised spaces — spotting where policy, etiquette, or technology could be improved to unlock hidden capacity.
Understanding this difference allows managers to improve not only space efficiency but also employee experience — ensuring that when people come into the office, they can find a seat, a room, or a zone that truly supports their work.
Behavioural Analytics & Observation Studies: Seeing the Whole Picture
To move beyond misleading numbers, facility teams are turning to behavioural analytics and observation-based studies. These methods reveal how, when, and why people actually use different spaces — combining data from sensors, badge swipes, Wi-Fi, and human observation.
They help answer key questions:
- Which zones see the most consistent activity?
- Are people working solo, in pairs, or in groups?
- How long do employees stay in each area?
- What informal “signs of life” exist that sensors might miss?
By blending quantitative and qualitative insights, you uncover the behaviour behind the metrics — moving from basic headcounts to actionable understanding.
How Accordant by CadM Elevates Insight
Accordant by CadM supports this behavioural approach with tools designed for multi-layered observation and scenario planning.
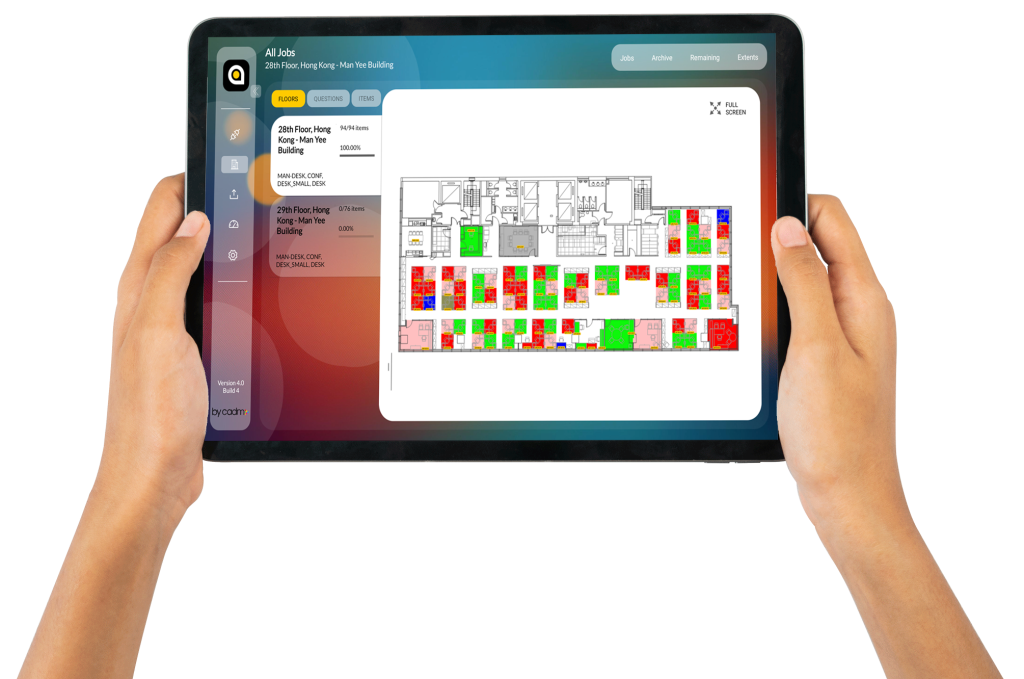
Observation Surveys & Accordant Anywhere
Using Accordant Anywhere, facilities teams can walk floors with a tablet or smartphone, logging “used,” “unused,” and “signs of life” across desks, meeting rooms, and breakout zones. This captures nuances such as blocked desks, underused large rooms, or shifting collaboration hotspots.
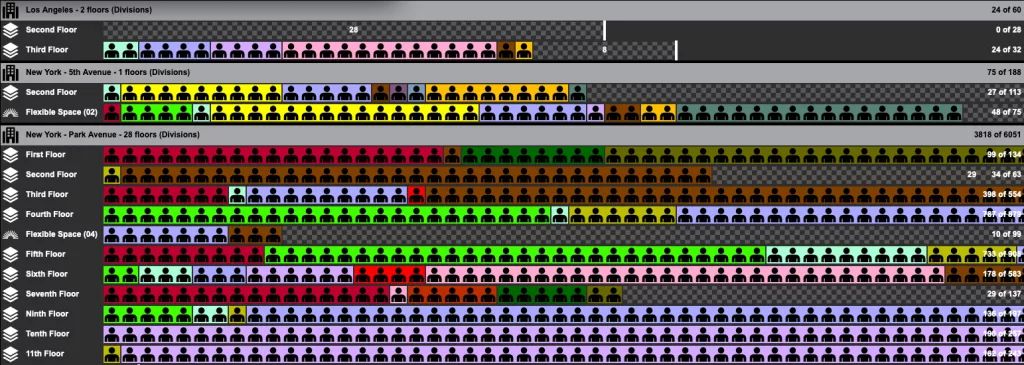
Multi-Source Integration
Accordant unites manual observations with booking, sensor, and Wi-Fi data to form a composite view of true utilisation. This is critical during the holiday season, when hybrid and flexible use blur the lines between booked and genuinely occupied.
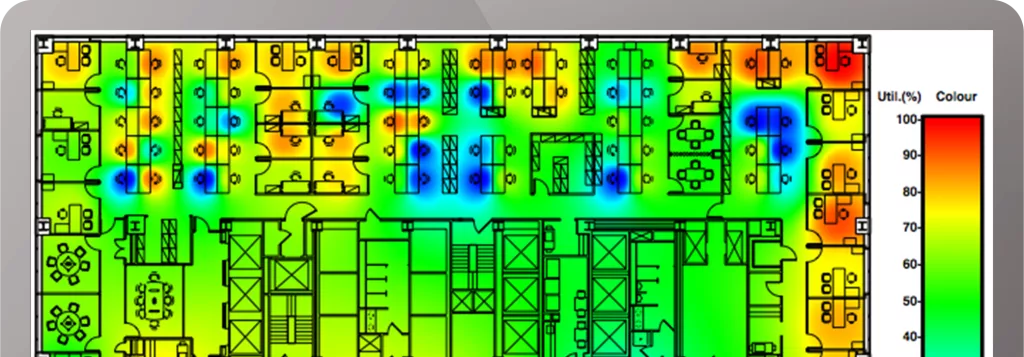
Visualisation & Reporting
Interactive floorplans and heat maps translate data into a clear story — showing where utilisation has genuinely dropped versus where it’s simply been blocked. These visuals help leaders see the difference between “low occupancy” and “inefficient use.”
Scenario Planning
With Accordant’s Strategy module, you can model flexible “slots” per employee rather than fixed desks — ideal for hybrid operations. This supports smarter allocation without unnecessary space reduction, helping you plan for post-holiday recovery.
A Practical Example
Imagine an office of 10,000 sqm. Using Accordant:
- Desk occupancy drops from 65% to 45% post-Halloween.
- Meeting room bookings stay at 70%, but observation reveals actual seat utilisation at only 40%.
- Breakout areas show 70% of previous activity.
- Arrival times shift later in the day, and departures earlier.
These insights highlight that the office isn’t underused — it’s misused. Too many small meetings occupy large rooms, and too many desks are blocked by belongings or unclaimed bookings.
Rather than cutting space, you might:
- Introduce better booking etiquette and auto-release systems.
- Convert oversized rooms into smaller, more flexible ones.
- Reorganise zones to reflect how people actually collaborate.
- Adjust cleaning, maintenance, and energy schedules to fit new daily rhythms.
Turning Ghostly Numbers into Strategy
Here’s how to turn seasonal dips into actionable insight:
- Benchmark Before the Dip: Run observational surveys early to capture accurate baselines.
- Differentiate Blocked from Used: Identify space that’s unavailable but unproductive — your biggest hidden inefficiency.
- Layer Data Sources: Merge occupancy, booking, and observation data to reveal behavioural context.
- Model Flexibility, Not Reduction: Use Accordant’s hybrid slot modelling to simulate realistic utilisation rates.
- Tell the Story Visually: Heat maps and dashboards help leadership understand what’s really happening.
Turning Fright into Foresight
While seasonal slowdowns might make office metrics look gloomy, they also present a perfect opportunity for reflection. With behavioural analytics, organisations can transform spooky utilisation drops into valuable learning moments — refining workspace strategy for the year ahead.
The lesson? Don’t let ghostly occupancy data haunt your decisions. Instead, focus on the human side of workspace management. By understanding the behaviour behind the numbers, you can build environments that stay lively, engaging, and efficient — all year round.