
RSF is an important definition which is frequently misunderstood and is, in practise, often calculated in different ways. In the US, most office space is leased in the basis of an agreed RSF. In the UK, the way in which space is measured is covered by the Royal Institution of Chartered Surveyors (RICS) – in the US, the Building Owners and Managers Association International (BOMA) publish a definition for how this should be calculated which is widely used but is by no means legally binding.
The BOMA standard sets out clear definitions for “usable area” and “rentable area” which are, in fact, remarkably similar to the RICS standards.
From BOMA, Usable Area (USF) is the private space that tenants can use to house their own personnel, furniture and equipment. It is measured from the office side of the common corridor walls, the inside of exterior building walls, and the middle of partition walls separating the tenant’s space from space occupied by other tenants. It does not includerestrooms, elevator shafts, fire escapes, stairwells, electrical and mechanical rooms, janitorial rooms, elevator lobbies, or public corridors (for example, a corridor leading from the elevator lobby to the entrance of a tenant’s office).
Rentable Area (RSF) is more inclusive—it consists of all space except for the elevator shaft and fire-escape stairwell. It is measured from the inside surface of exterior building walls and the office side of the walls of major penetrations. Unlike usable space, rentable space includes restrooms, electrical and mechanical rooms, janitorial rooms, elevator lobbies and public corridors.
The ratio of USF to RSF is sometimes called the “load factor” and prospective tenants often ask for this figure to gauge the amount of space they will actually be able to use. In the context of any given lease, the USF and RSF can be regarded as fixed amounts although the USF may vary in some circumstances.
This is not a major issue as the task is to account for space across cost centres which includes both non-USF items and a notional amount of unmeasured landlord space.
For a complete copy of the BOMA Standard, contact the Building Owners Managers Association International, 1201 New York Avenue, N.W., No. 300, Washington, D.C. 20005
Allocating Space
The requirement for allocating space as opposed to measuring is somewhat different. From the tenant’s perspective the objective is to achieve an accurate and equitable division of the space that has been paid for based on functions and cost centers. There is no requirement per se to use any specific standard for an internal costing exercise and therefore nothing to stop a company from simply saying “I have 100 positions so I will split my space into 100 equal parts and allocate internal costs to whoever sits at each desk”.
In practise, this is not suitable for larger organisations who wish to reflect the use of space more accurately and reflect the impact of shared areas within the office. This is where software systems like Accordant and Archibus come in to the picture.
From an Archibus perspective, the method of approach is “bottom up” in that you measure areas (eg rooms or individual workstations) one at a time and keep going until you have either a complete picture of a floor or at least as much as you feel you want to measure. This method puts no checks and balances on the measurement and when all data are recorded, the system simply allows you to scale up what you have to figures that you enter for USF and RSF.
This is clearly prone to error so the Accordant procedure is simply to set up a balance based on the measured area and check all allocations against this. In effect you are mimicking the process that the landlord used to define the space in the first instance and then gradually refining the content of a managed perimeter.
The initial managed perimeter defines the total measured space for a given floor and creates balancing figures to ensure that the same measured amount is always declared and reported on. You can subdivide this area “top down” to treat spaces differently but the net space of the floor will remain constant as long as you do not alter the perimeter.
This gives you a very simple set of figures against which everything you do can be checked – Archibus does not check this, it allows you to measure as much or as little as you like and then scale this up to an arbitrary figure.
Worked Examples
For the sake of example, let us assume that a company has taken a lease on a building where the RSF, as contracted between landlord and tenant, has been defined as exactly 1,000 square feet.

With Accordant, the approach is “top down” as discussed so the first task is to accurately define the extents of the area to be managed. This process is designed to replicate the global measurement of space.
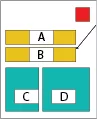
In the example plan to the left we have drawn the perimeter and found it to be 1,100 square feet. Typically, this will be because there is an area within the perimeter which is not part of the RSF (eg a fire escape as defined by BOMA). In our example 100 sq ft.
We now have a 1,100 sq ft drawing with 1,000 sq ft of managed area. This means that every time we allocate space, we should hit exactly 1,000 sq ft – if we don’t there is clearly a problem. This is the basis for the Accordant balance, it is much the same concept as a financial balance sheet and is designed to highlight areas where mistakes have been made. Archibus by contrast, simply allows you to ignore them.
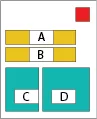
If we create new regions inside the managed area they can be subtracted from the “rentable” (like our first RED area) or they can be allocated as part of it like our new orange and green areas.
In this example green areas will be directly allocated to a department and orange areas shared or pro-rated so that all cost centers attached to a floor (or building) that owns them will get a share.
A,B and C are 150 sq ft and D is 200 sq ft
We can now easily complete the top half of our balance sheet which will look very much like the following if we define “A” as Floor Pro-rate and “B” as Building.
| Total Measured | Non Chargeable | Chargeable | Shared (Floor) | Shared (Building) | Total |
| 1,100 | 100 | 350 | 500 | 150 | 1,000 |
Note that the floor share in this example is 500 sq ft because it includes both the defined floor pro-rate of area A and the remaining (left-over) space in white (ie 1,000-A-B-C-D).
In Accordant, the figure in the right hand column is normally marked “Total” – this may equate to the rentable, the useable or neither depending on how you have structured your measurements. It is simply the figure that you know you want to get back to if you allocate your space. In many cases it cannot be the RSF because there are areas outside of the managed space that a landlord can charge for and it cannot normally be the USF because this does not contain many areas that you may still wish to recharge to cost centers (rest rooms, plant rooms etc)
Let’s now define two cost centers, “SALES” and “IT” and we will assign these to areas C and D respectively. This will give us a bottom half of the balance sheet which will now look like this:
| Total Measured | Non Chargeable | Chargeable | Shared (Floor) | Shared (Building) | Total |
| 1,100 | 100 | 350 | 500 | 150 | 1,000 |
| Cost Center | Chargeable | Shared (Floor) | Shared (Building) | Total | |
| SALES | 150 | 214.29 | 64.29 | 428.58 | |
| IT | 200 | 285.71 | 85.71 | 571.42 | |
| Total | 350 | 500 | 150 | 1,000 |
When we run a balance on this space we can see that the bottom right hand figures match which tells us the space is properly allocated and that all can be accounted for – this means that is we run a space allocation report, the figures will add up.
The figures at the top equate to Measured and the figure on the bottom Allocated. The measured figure is clearly much easier to calculate (it is derived form the actual fixed area of drawn poly-lines) less prone to error and should remain constant unless you change the managed perimeter of any given floor. The allocated figure however is a more complex calculation which will go out of balance if allocation errors are made.
Issue 1. RSF is not the same as measured area.
CAD is an extremely accurate tool which will provide measurements on a drawn area to many decimal places derived from the geometry of the lines used.
The RSF figure quoted on a lease may differ significantly from the totals derived as the landlord is unlikely to have worked from the same drawing and in any case, figures are likely to be rounded off. The RSF may also include common areas of a building or Estate that the landlord may charge for (usually split between a number of tenants). In this latter case, it may not be practical to include additional areas in managed drawings.
To accommodate this Accordant, like other systems , allows for the recording of a fixed RSF figure for a given lease and this can then be apportioned by adjusting allocations up (or occasionally down.) This is done by defining a ratio of the Total Measured Space (excluding any non chargeable parts) to the static RSF. This is not unlike the “load factor” defining the ratio of RSF to USF but note that it will usually not be the same as the load factor because the total space that you are allocating generally includes items that are not in the USF.
So, let’s assume that in our example, there is another 500 sq ft that the landlord has charged the company for based on a share of a public area. This now means we have a total RSF of 1,500 sq ft but a nominal total of only 1,000 sq ft measured in our drawings.
Given that our aim is to recharge all of the space paid for, a perfectly valid approach is to create new areas and/or drawings to reflect this additional area (for example as a simple rectangle in a “Common” floor). This may not be useful for a number of reasons so the alternative is to use the static figure and adjust accordingly .
Revised Allocation Including RSF adjustment.
| Cost Center | Chargeable | Shared (Floor) | Shared (Building) | Total | RSFFactor | RSF |
| SALES | 150 | 214.29 | 64.29 | 428.58 | 1.5 | 642.87 |
| IT | 200 | 285.71 | 85.71 | 571.42 | 1.5 | 857.13 |
| Total | 350 | 500 | 150 | 1,000 | 1.5 | 1,500 |
Issue 2. “DEF_DEPT” and “DEF_DIVN”
New Accordant users often wonder why they see “DEF_DEPT” appear in allocations when they have not made any assignment to this cost center. The reason is very simple, it means that they have defined an area as directly chargeable but have not assigned any cost center to it.
Every building defined in Accordant must be assigned to a cost center. Out of the box, the system has a single cost center called “DEF_DEPT” and this is often used for new buildings. You can in fact use any cost center defined in the system but the advantage of using a dummy one is that it becomes very clear when you have forgotten to allocate something.
All newly created locations are assigned to the building default and any space that has been flagged as chargeable but not assigned to a cost center will also be given this code. In our example, if we had forgotten to allocate area “C” to “SALES” our bellows the line balance (allocation) would look like this.
| Cost Center | Chargeable | Shared (Floor) | Shared (Building) | Total | RSFFactor | RSF |
| DEF_DEPT | 150 | 214.29 | 64.29 | 428.58 | 1.5 | 642.87 |
| IT | 200 | 285.71 | 85.71 | 571.42 | 1.5 | 857.13 |
| Total | 350 | 500 | 150 | 1,000 | 1.5 | 1,500 |
The numbers are still correct but there is clearly an issue and Accordant provides a useful tool allowing you to inspect the allocations in each row to see where they are derived from.
Issue 3. RSF in a report differs from static Total
When you run a space report you would expect to see the total RSF as the summation of each line adjusted for RSF. This should always be the case for a balanced allocation.
The RSF factor is simply defined as ratio of static RSF (if defined) to the Total measured space (excluding any non-charged areas of course). By design, this is calculated on the above-the-line total as it hardly varies.
Therefore;
RSF_FACT = RSF / SUM(MEASURED)
On each row below the line we show you the amount of allocated space and then multiply this by RSF_FACT to show the contribution of the cost center to RSF:
So for each department;
RSF_CONTRIBUTION = ALOCATED(DEPT) * RSF_FACT
For the whole building this is clearly:
RSF_CONTRIBUTION = SUM(ALLOCATED) * RSF_FACT
Substituting for RSF_FACT as defined above we se that:
RSF_CONTRIBUTION = SUM(ALLOCATED)*(RSF / SUM(MEASURED))
Therefore, if SUM(ALLOCATED) is exactly equal to SUM(MEASURED), the RSF_CONTRIBUTION will equal the RSF. In other words, If the space is balanced the totals should be the same.
Let us assume that in our simple example we define area “B” as shared (as we did previously) but set its PRORATE to 0. This means that it cant be shared so will not appear in the below the line allocations at all BUT it will still be counted in the measured space.
As we can see from the table below, the missing space throws out the allocation and the equation does not balance – this shows as a result an incomplete RSF Contribution of 1,275 instead of 1,500.
| Cost Center | Chargeable | Shared (Floor) | Shared (Building) | Total | RSFFactor | RSF |
| SALES | 150 | 214.29 | 0 | 364.29 | 1.5 | 546.44 |
| IT | 200 | 285.71 | 0 | 485.71 | 1.5 | 728.56 |
| Total | 350 | 500 | 0 | 850 | 1.5 | 1,275 |
Issue 4. RSF on a Floor has changed
The RSF for a given lease is a single figure which may encompass a number of floors. Clearly each floor forms a part of the calculation when a landlord derives the RSF – however, its contribution to the total RSF based on allocations may vary.
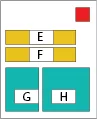
To Illustrate this, let us double our example building in size so that we have 2,000 sq ft in total space and a 3,000 sq ft RSF,
| Total Measured | Non Chargeable | Chargeable | Shared (Floor) | Shared (Building) | Total | |
| 1,100 | 100 | 350 | 500 | 150 | 1,000 | (Floor1) |
| 1,100 | 100 | 350 | 500 | 150 | 1,000 | (Floor 2) |
| 1,200 | 200 | 700 | 1,000 | 300 | 2,000 |
| Cost Center | Chargeable | Shared (Floor) | Shared (Building) | Total | RSF Contribution | |
| Floor 1 | SALES | 150 | 214.29 | 64.29 | 428.58 | 642.87 |
| IT | 200 | 285.71 | 85.71 | 571.42 | 857.13 | |
| 1000 | 1,500 | |||||
| Floor 2 | HR | 150 | 214.29 | 64.29 | 428.58 | 642.87 |
| IT | 200 | 285.71 | 85.71 | 571.42 | 857.13 | |
| 1000 | 1,500 | |||||
| Total | 700 | 1,000 | 300 | 2,000 | 3,000 |
In our first iteration, the floors are identical so they contribute the same amount to RSF and the floors themselves have exactly the same allocated space as managed.
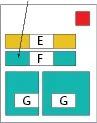
We are now going to change Area “F” and take it from Building pro-rate to directly charged and then assign it to IT.
| Total Measured | Non Chargeable | Chargeable | Shared (Floor) | Shared (Building) | Total | |
| 1,100 | 100 | 350 | 500 | 150 | 1,000 | (Floor1) |
| 1,100 | 100 | 500 | 500 | 0 | 1,000 | (Floor 2) |
| 1,200 | 200 | 850 | 1,000 | 150 | 2,000 |
| Cost Center | Chargeable | Shared (Floor) | Shared (Building) | Total | RSF Contribution | |
| Floor 1 | SALES | 150 | 214.29 | 26.47 | 390.76 | 586.14 |
| IT | 200 | 285.71 | 35.29 | 521.00 | 781.50 | |
| 911.76 | 1367.64 | |||||
| Floor 2 | HR | 150 | 214.29 | 26.47 | 390.76 | 586.14 |
| IT | 350 | 285.71 | 61.77 | 697.48 | 1046.22 | |
| 1088.24 | 1632.36 | |||||
| Total | 850 | 1,000 | 150 | 2000 | 3000 |
Note that the totals per floor on the above line table (Measured) remain the same as the physical space on the floors have not changed. However in the below the line (Allocated) calculations show that the allocation space of Floor 2 is now slightly bigger than the floor is in reality and the allocation space of Floor 1 is slightly smaller. This means their contributions to RSF have also gone up and down respectively. The important fact though is that the space still balances.
Changing building common areas will always result in a variation in contributed RSF when expressed as a function of allocation.